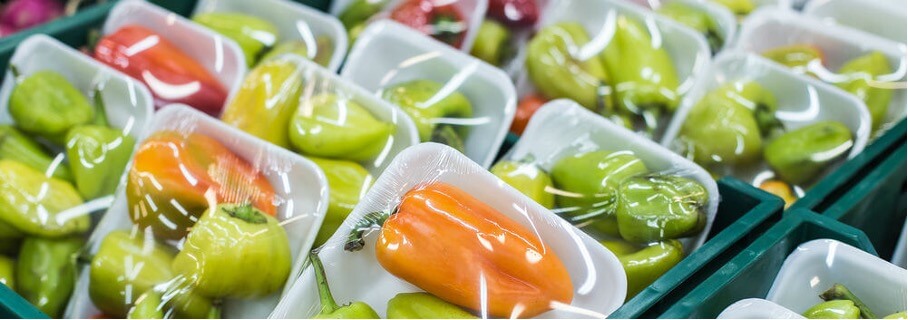
Food gases are produced for almost all foodstuffs and from mixtures of Nitrogen, Carbon Dioxide and Oxygen in varying proportions depending on the type of food. These mixtures not only protect the food from negative effects, but also make the external appearance of the food more vivid, increase the yield by extending the shelf life of the food.
Food gases vary according to the products requested, ambient temperatures and similar conditions. Our food gas mixing ratios and usage product table are as follows.
| FOOD GASES | PRESSURE | M3 |
|---|---|---|
| MAP GAS A (%100 N2) | 200 BAR | 9,4 m3 |
| MAP GAS 35 (%35 CO2 + Balans N2) | 200 BAR | 13,04 M3 |
| MAP GAS 4 (%30 CO2 + Balans N2) | 200 BAR | 11,44 M3 |
| MAP GAS 5 (%40 CO2 + Balans N2) | 200 BAR | 12,34 M3 |
| MAP GAS 6 (%50 CO2 + Balans N2) | 200 BAR | 13,4 M3 |
| MAP GAS 12 (%20 CO2 + Balans O2) | 200 BAR | 11,9 M3 |
| MAP GAS 13 (%25 CO2 + Balans O2) | 200 BAR | 12,27 M3 |
| 12,67 M3 | 200 BAR | MAP GAS 14 (%30 CO2 + Balans O2) |
| Product | CO2% | N2% | O2% |
|---|---|---|---|
| White Meat | 25-30 | 70-75 | |
| Cheese | 25-30 | 70-75 | |
| Cooked Meat | 25-35 | 65-75 | |
| Crawn, Mussel | 30-40 | 30-40 | 30 |
| Pizza | 40-50 | 40-60 | |
| Bread | 50-60 | 40-50 | |
| Bakery Products | 50-60 | 50-60 | |
| Coffee | 100 | ||
| Nuts, Potato Chips | 100 | ||
| Red Meat | 20-35 | 65-80 | |
| Vegetables, Fruits | 3-5 | 90-94 | 3-5 |